Bitcoin SV looked headed for a drop to recent lows at $150 while Dash formed a bullish pattern that was invalidated in the face of selling pressure. Ethereum Classic showed it was heading upwards, but could take a few more trading sessions to confirm bullishness.
– Advertisement –
Bitcoin SV [BSV]


Source: BSV/USDT on TradingView
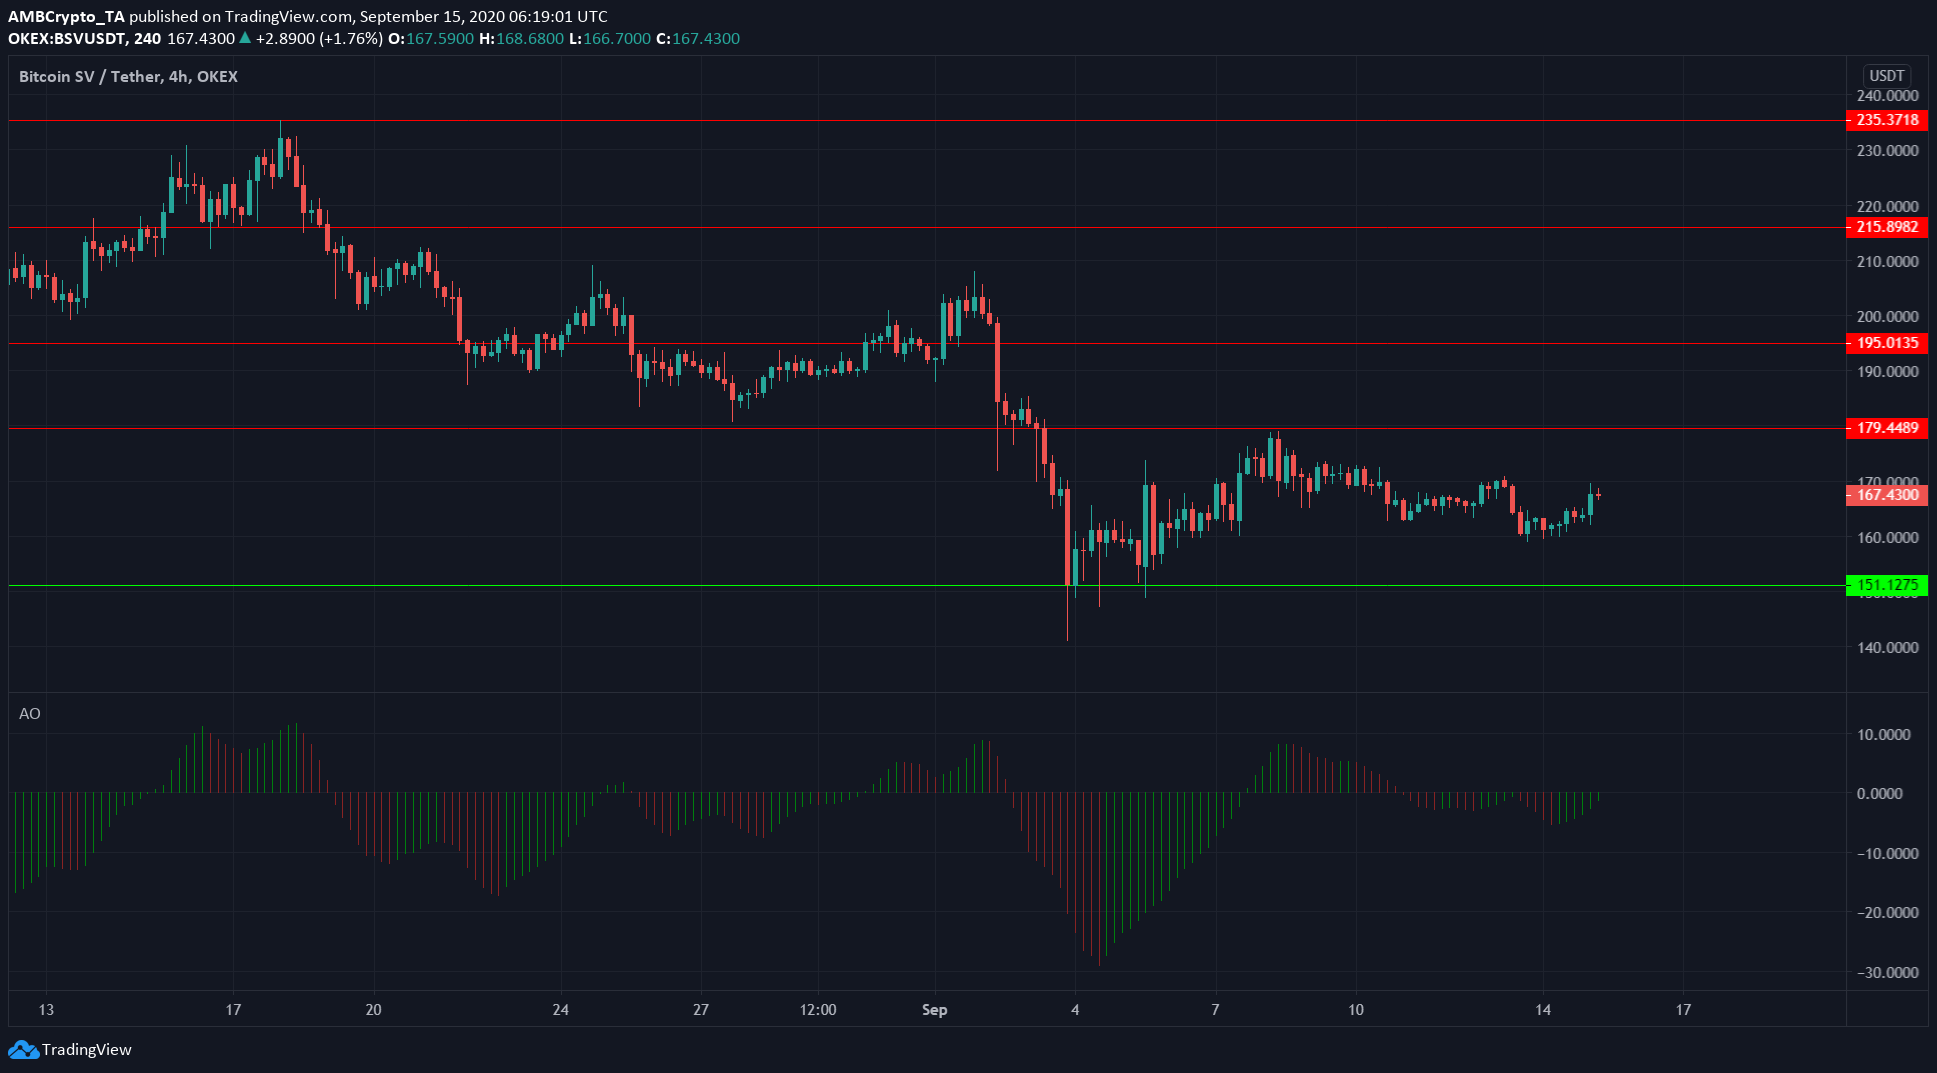
On longer timeframes, BSV exhibited bearish patterns. On the shorter timeframe too, BSV showed bearish momentum. It was rejected at the resistance level at $179 and has not approached the level since.
– Advertisement –
Awesome Oscillator also showed momentum was in bearish territory. In conclusion, it is likely that BSV drops to resistance in the $150 region.
In related news, Bitcoin Association announced that it had partnered with the Chinese digital asset wallet, DotWallet, to host the second iteration of DotCamp for BSV. Held on 19th and 20th September, the event aims to educate developers and business educators on trends in blockchain technology.
Dash [DASH]


Source: DASH/USDT on TradingView
As shown by the white trendline, DASH exhibited an ascending triangle that appeared to break out to the upside on above-average volume. Yet it was quickly met with a wave of selling pressure and DASH slipped beneath resistance. After the drop indicated by the cyan arrow, DASH attempted once more to breach resistance but failed.
Generally, the more often a level is tested, the weaker it gets. Yet, in this context, the market simply lacked the conviction to break to the upside, as evidenced by the sell-off that occurred as soon as price moved past resistance.
DASH could move past resistance once more, but it has to successfully flip resistance to support before it can gain bullish traction. Another sell-off could prompt DASH to seek support at the $68.5 region.
Ethreum Classic [ETC]


Source: ETC/USD on TradingView
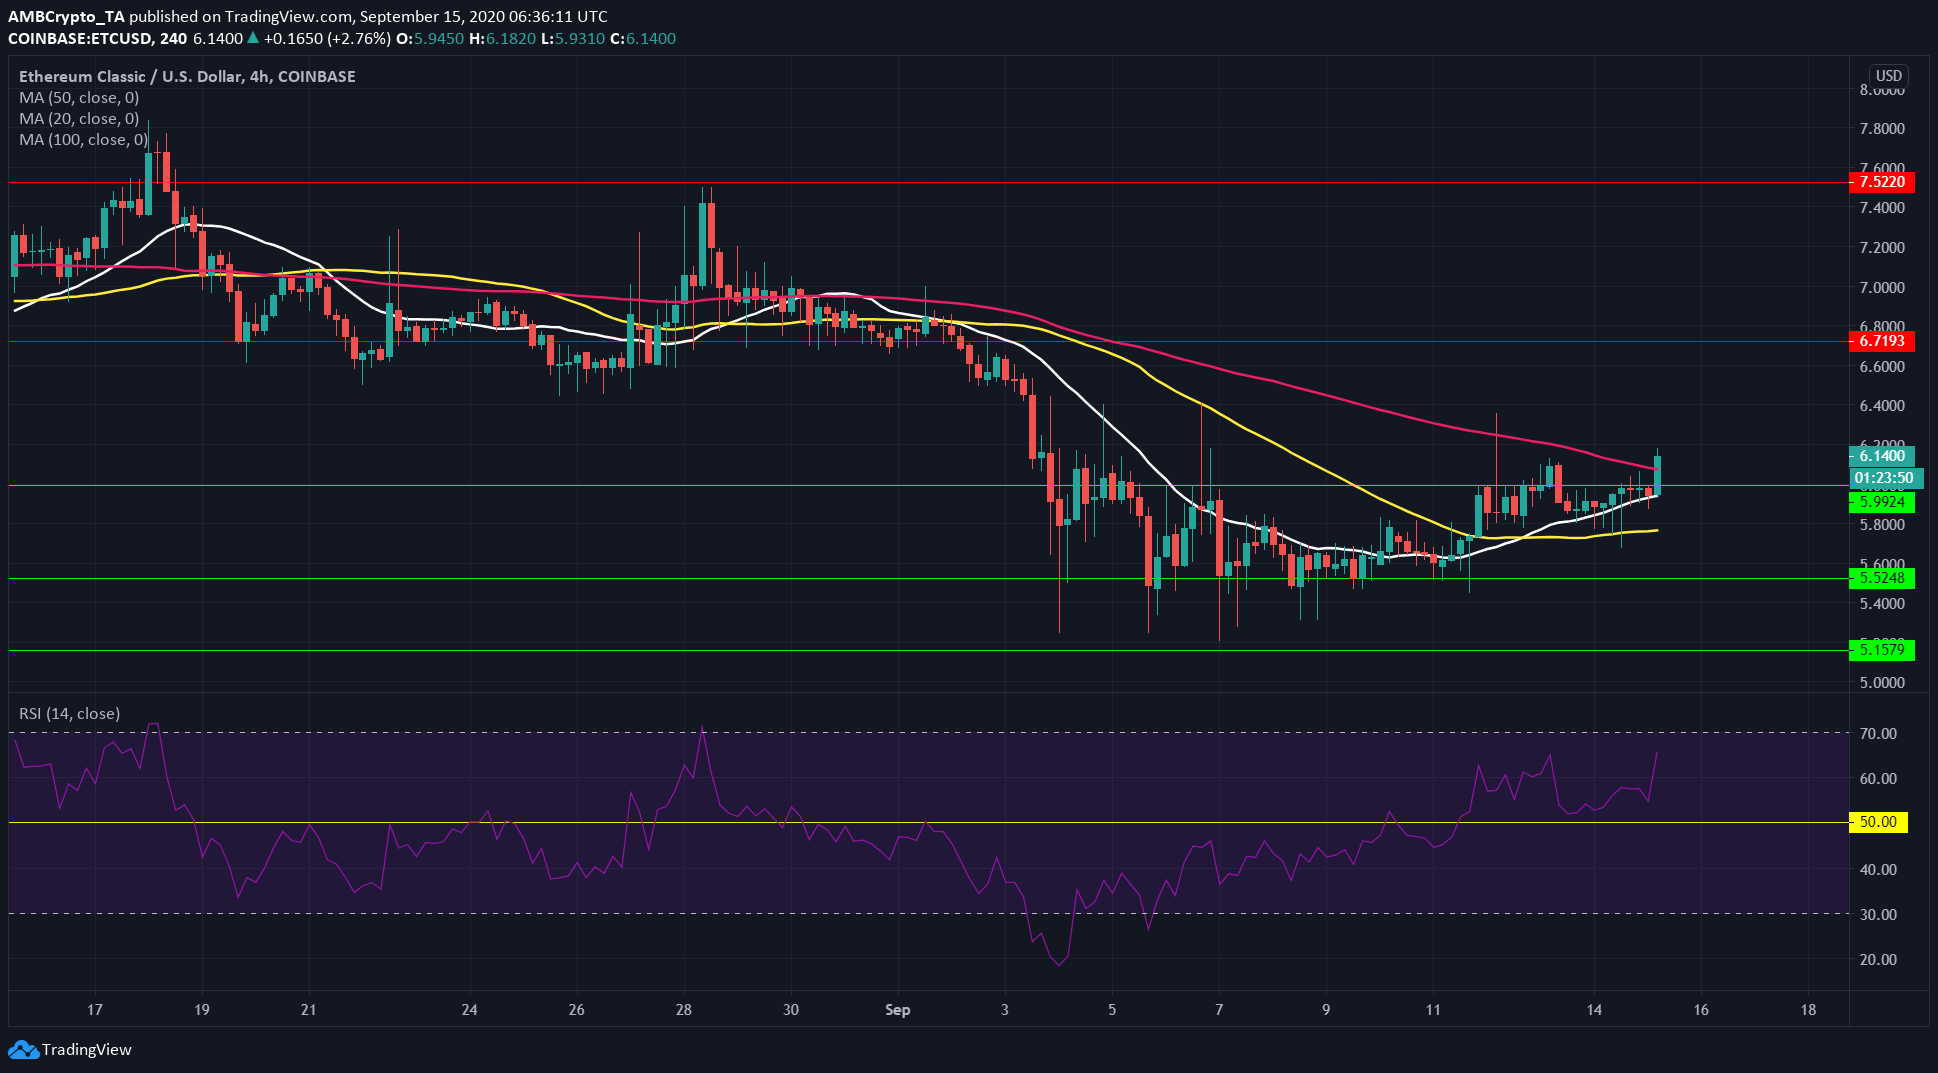
Ethereum Classic showed signs of bullishness. ETC climbed above 100 SMA (pink), although the price hadn’t closed above at the time of writing. 20 SMA (white) also served as support in recent trading sessions.
RSI was at 65, a bullish value. It did not swing beneath neutral 50 in the past few days, indicating an uptrend for ETC.
If ETC closes above 100 SMA, it is likely the price can reach higher to test resistance at $6.72.